In the beginning of December 2025 I started looking at frameworks for building immediate mode UIs. Coming from web development, retained mode UIs were all I knew, so when I started building crypto tools (crypto-orderbook, crypto-futures-arbitrage-scanner, binancef_l3_estimate_go) I reached for them by default.
Then I wanted to glue all those projects into a single trading tool. I started with what I knew, react/solid/svelte, klinecharts, a few other charting libraries. But I was already using tapesurf and MMT every day, both fast and smooth (tapesurf on webgl, MMT on imgui), and that set a high bar for the UX I wanted. My web stack couldn’t reach it. Bottlenecks, dropped frames. I wanted something fast. Really fast.
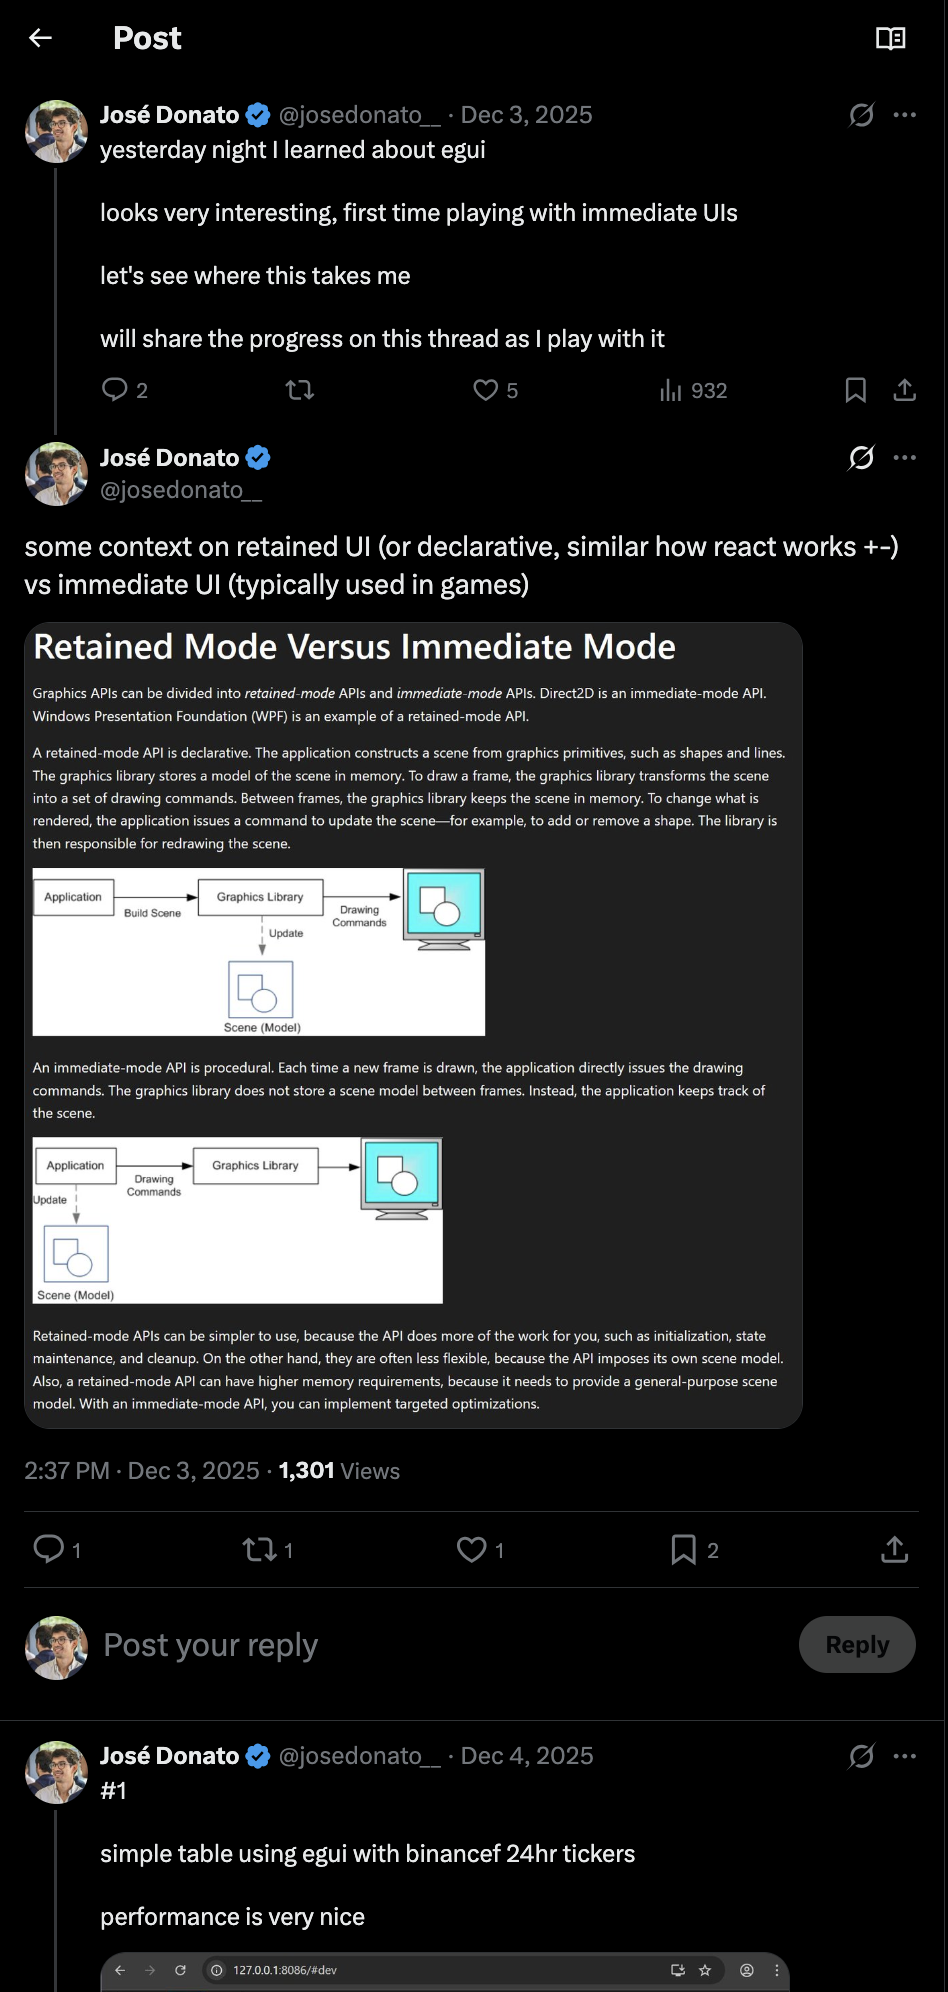
I did some research and landed on native immediate mode UIs, a completely new concept for me at the time.
Immediate mode UIs are common in games, so the model seemed worth trying for what I wanted to build. I started with egui, the rust option, and I was impressed. The experience was nice and the low level control made sense for trading applications. Then vehcktor suggested I try dear imgui, a c++ library that powers countless native applications and has over 73k stars on github. Thank you vehcktor for the push. What sold me was pairing it with emscripten. I wanted one version I could open on any device, my laptop at my desk, my phone when I’m out, no install. Compiling the c++ to WASM gave me exactly that, a native-grade immediate mode UI running in a browser tab, the same build everywhere. As you’ll see in the rest of this post, that’s what let me ship cryexc this fast.
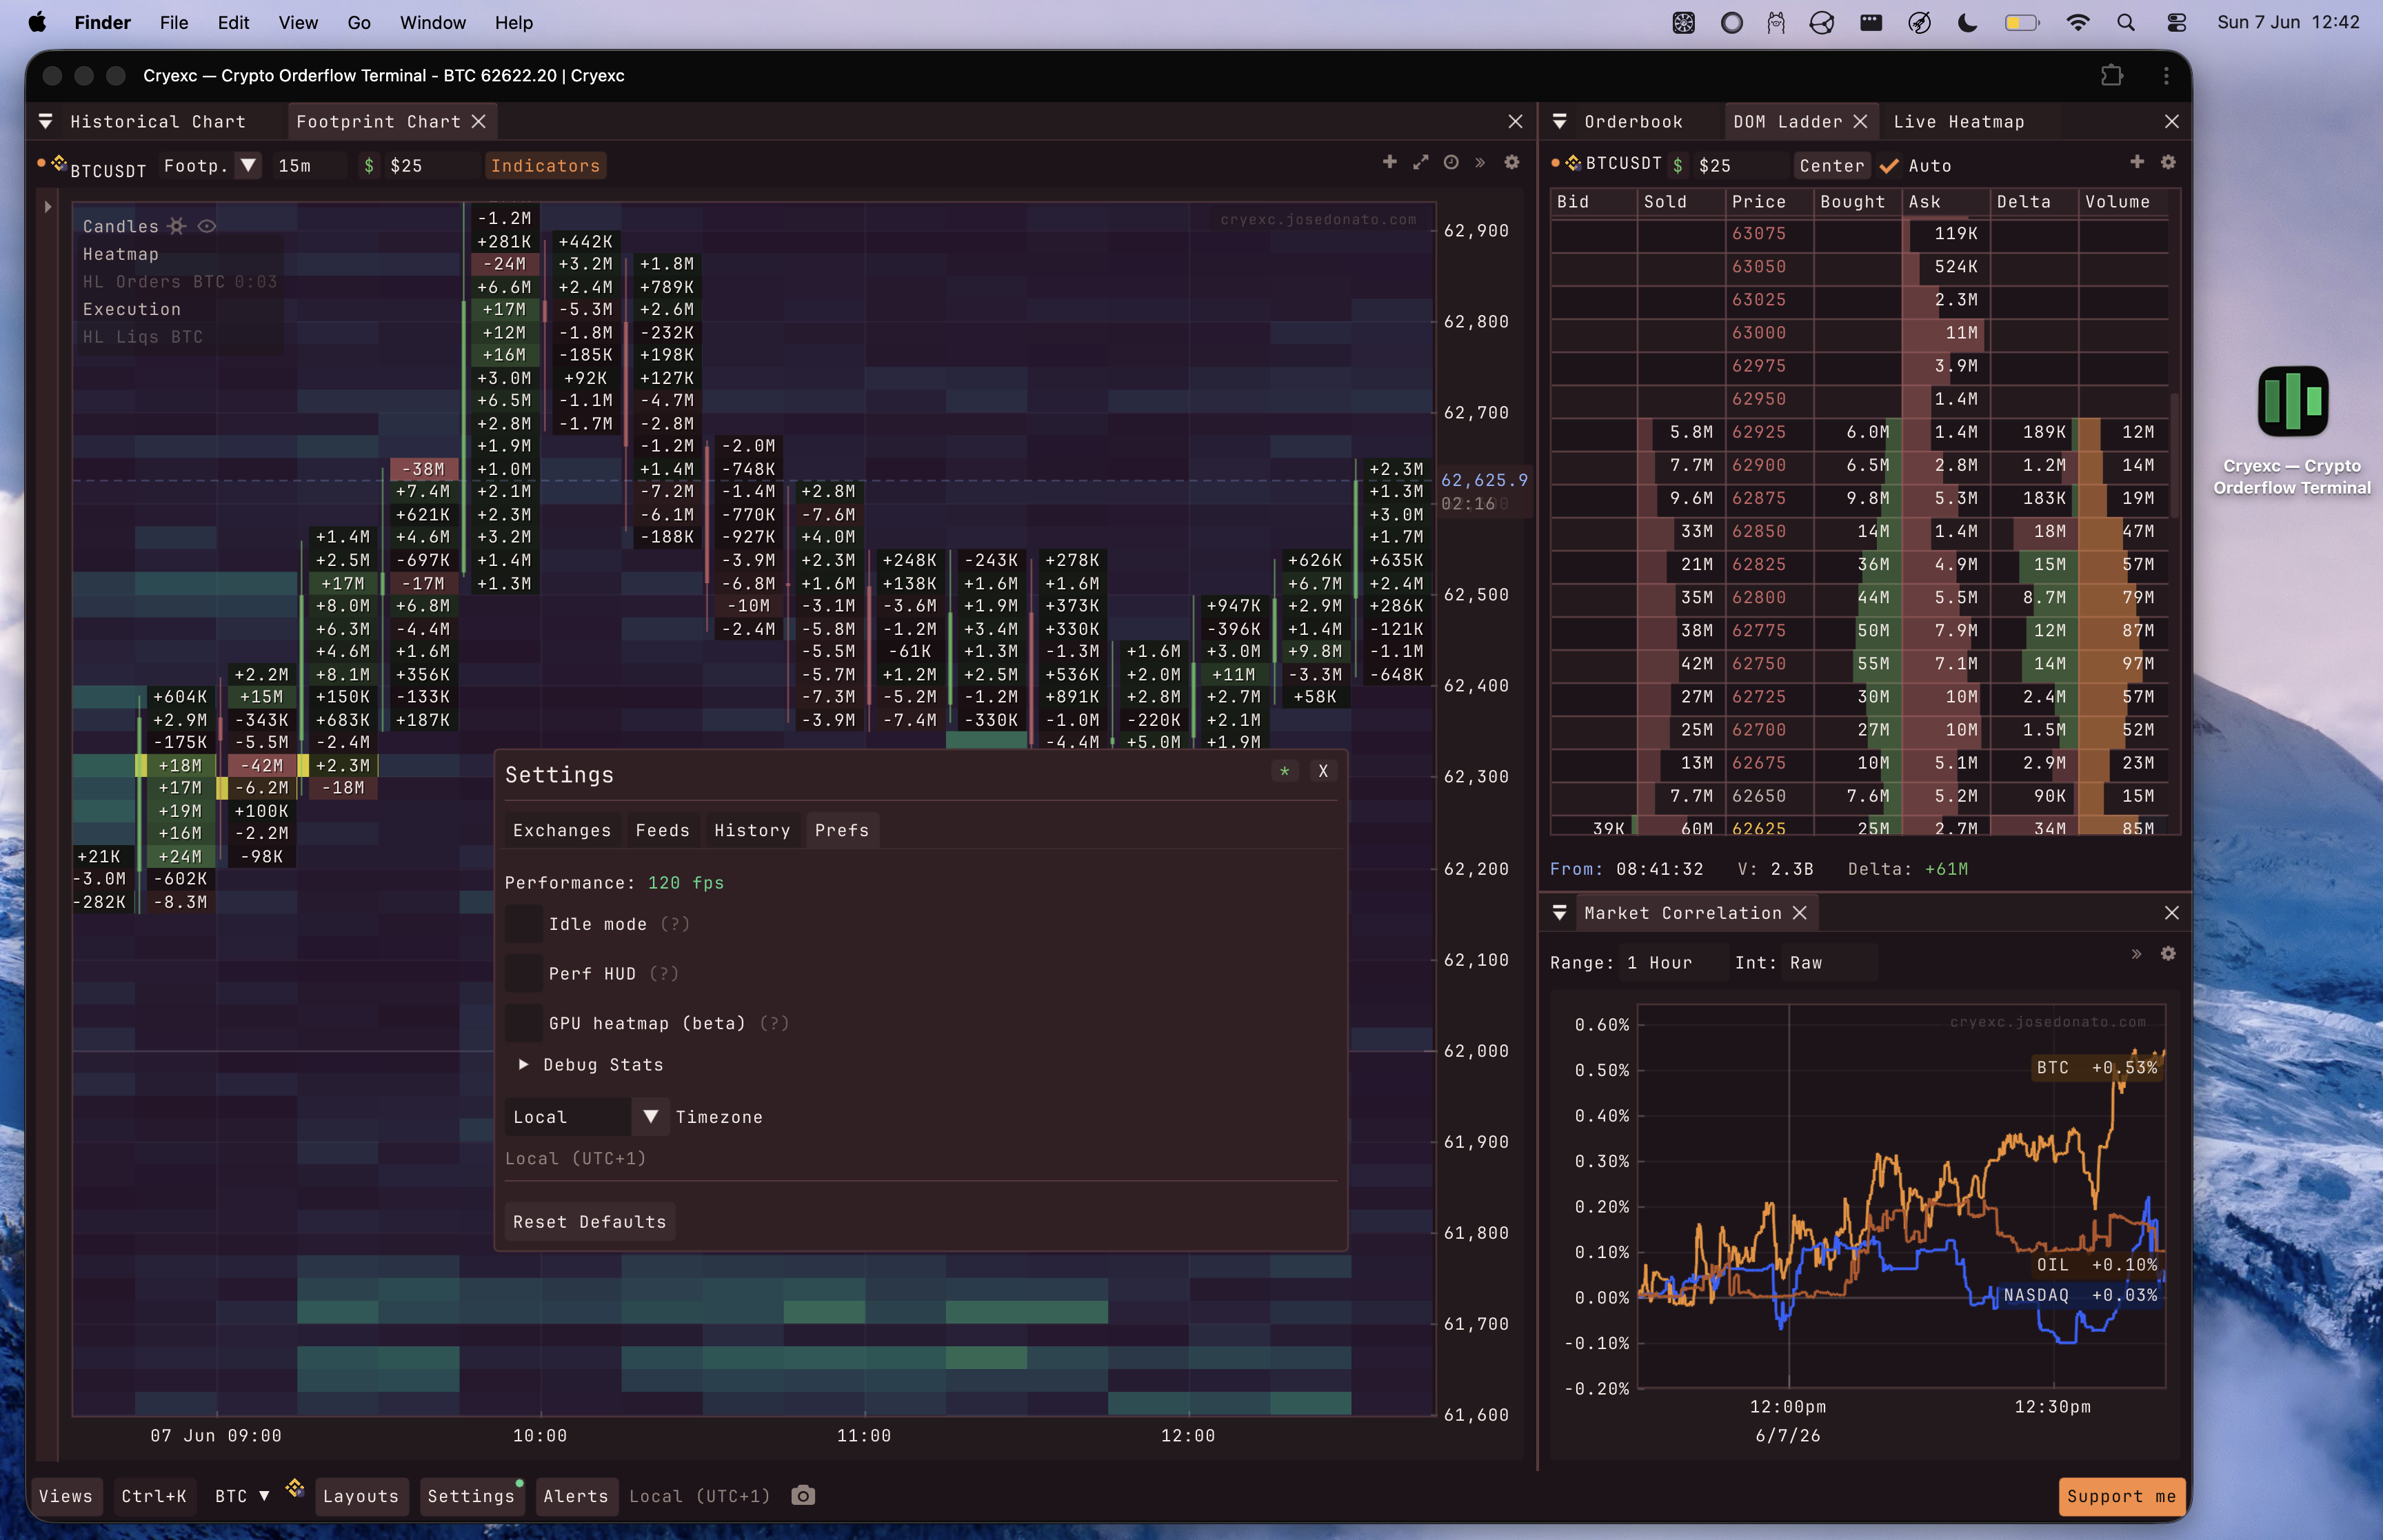
I kept sharing my progress as I learned more about imgui. I shared everything in this thread. In a few days I had a footprint chart, a heatmap, a volume profile, and a DOM ladder all running at the same time, inside a browser tab, pulling live tick data straight off Binance futures websockets. I moved the windows around. Resized them. The FPS counter didn’t flinch. It sat at 120 the entire time. That was the moment I stopped thinking about Dear ImGui as a curiosity and started thinking about it as the right tool for this kind of application.
As I kept building this in my free time, the vision got simple. A box that runs in my browser and needs no backend, connecting directly to the exchanges for everything it needs.
Why immediate mode UI for trading
Most UI stacks keep a persistent tree around and update it in place. On the web that tree is the DOM, owned and repainted by the browser. React sits on top and diffs each render against the last one to compute the minimal DOM changes. Solid skips the diffing and wires reactive updates straight to the nodes that changed. Qt and GTK keep a retained widget tree you mutate by hand. Different strategies, same premise. A long-lived structure that something has to keep in sync with your data, and a browser or window system that has to lay it out and repaint it. For most applications that’s exactly right. A trading terminal isn’t most applications.
In a live orderbook, the data changes on every tick. Binance futures BTCUSDT can print 5,000+ trades per minute during volatility. Each trade can shift every price level in your footprint, every bid and ask in your ladder, every bar in your CVD. Now the layer keeping that tree in sync is grinding through thousands of updates a second, and the browser is laying out and repainting that many nodes, before you’ve done any of the actual math.
Dear ImGui is immediate-mode. You don’t describe a widget tree, you just draw. On every frame you call ImGui::Begin(), you call the widget functions, you call ImGui::End(). No state machine, no diff, no retained tree. If data changed, it just shows up next frame because you’re reading it again.
Immediate mode: no stored widget tree. Each frame reads your data and draws. Data changed? It just shows up next frame — no diff, no reconciliation.
ImGui::Begin("footprint");
for (auto& level : footprint.levels) {
    draw_bid_ask_bar(level.price, level.bid_vol, level.ask_vol);
}
ImGui::End();
That’s roughly what the rendering looks like. Every frame. No conditional updates, no change detection. Just iterate over your data and draw it. The render loop runs at 120FPS on a decent machine, which means you get a new frame every ~8ms. Websocket messages arrive, get buffered into a shared structure, and the next frame picks them up. The visual latency between a trade printing on the exchange and appearing on screen is measured in single-digit milliseconds.
The tradeoff is real. You give up accessibility. Screen readers can’t traverse an ImGui canvas. Keyboard navigation outside of ImGui’s own model requires manual work. Search-engine crawlers see nothing inside the canvas. And things like text selection, right-click context menus, and font fallback behavior that you get for free in HTML require explicit implementation. For the trading tool I wanted to build with fast data and live updates, those are acceptable losses.
The stack
How it fits together matters here. As I explained above there’s no server in the live path. The browser is the runtime. A separate optional HTTP backend handles historical backfill, and that’s it.
Click any box to see what it does.
The pieces:
C++ + Dear ImGui owns the render loop entirely. All data fetching and transformation, widget logic, layout, footprint math, orderbook aggregation, drawing tools — everything that produces pixels lives here and paints it into a canvas.
Emscripten compiles that C++ to WebAssembly. The output is a .wasm binary plus a JS glue file. Emscripten handles the bridge: memory allocation, file system emulation, OpenGL to WebGL translation. For me, having this on the web was a must-have. I wanted to use it from any device, so emscripten plays a huge role.
SvelteKit + Tailwind is the shell. Landing page, routing, the <canvas> element that ImGui mounts onto. It loads the WASM module and hands off the canvas. After that, SvelteKit steps aside. The app frame is completely owned by ImGui. SvelteKit can also run on the server, which comes in handy when an exchange blocks client-side requests (the whole app normally runs in the user’s browser, but some exchanges block requests via CORS).
Browser websockets are how live data enters the system. The WASM module opens them directly to Binance, Bybit, Hyperliquid, OKX, Coinbase, Kraken, Lighter — whatever exchange’s public stream you want/select in the cryexc settings. No auth, no per-user server cost.
Optional history backend is a separate concern. I’m hosting a small backend that gives at most 4 hours of history for binancef btcusdt but if you want more historical trades, liquidations, depth snapshots, news, or open interest beyond what the hosted service already provides, you can point Cryexc at your own HTTP backend. It implements the Cryexc History Protocol v1 — three required endpoints, JSON only, no streaming. The spec is small enough to implement in an afternoon in any language.
Live data: websocket straight to canvas
The WASM module opens public websockets directly from the browser to each exchange. Binance’s public futures endpoints, Bybit, Hyperliquid, OKX, and the others listed above. All work from a browser tab with no auth. The latency is as low as it gets because there’s no intermediary.
A single Binance BTCUSDT@aggTrade stream can push 50–200 messages/second under normal conditions, spiking higher during liquidation cascades. Multiply by however many symbols and venues you have open, and the WASM module is processing thousands of messages a second across views.
On the WASM side, the JS glue receives websocket messages and calls a C++ function that writes into a lock-free ring buffer. The render loop reads from that buffer every frame. No frame waits for a message, and no message blocks a frame.
Two independent loops. The producer (websocket) writes; the consumer (render loop) reads. Click "messages arrive", then "render frame" — neither side ever waits for the other.
This design is what makes the “no signup, no backend” promise real. The exchange does the heavy lifting on the data side. The user’s GPU does the heavy lifting on the rendering side.
The downside: rate limits hit you, not a server. Also if you are on a region that a certain exchange blocks you won’t be able to access those feeds either (e.g., binance blocks US users). You can still hit a limit if you request too much data at once, or refresh often enough to fire a lot of requests at the exchange. It rarely happens though. Most feeds are a single symbol at a time, and I try to make as few requests as cryexc needs to work.
Rendering thousands of orderbook updates per second
The footprint chart is the most compute-intensive view. Every trade that arrives needs to update the correct price level, the correct side (bid or ask), and potentially shift the visible price range. During a fast market, you might get 2,000 messages in a single second on one symbol.
ImGui re-submits its entire draw list every frame. That part of the immediate mode model is real. Each frame reads the current state of the data structure and draws it, so if 2,000 messages landed since the last frame they all show up at once, with no diffing on the draw side.
The data behind that draw list is a different story. The romantic immediate mode ideal is “rebuild everything from scratch every frame,” and the hot paths break that rule on purpose. Rebuilding a 200-level footprint’s std::map on every frame was a 14.5ms bottleneck on its own. So the heavy views sit behind version counters and dirty-flag caches, the footprint volume map, the TPO and volume profile aggregations, the price-to-pixel transforms. They only recompute when the underlying data actually changes. Immediate mode for the draw calls, cached and dirty-flagged for the data prep. Pure rebuild-from-scratch doesn’t survive contact with a live footprint.
Zoomed in: tall levels, each fully drawn — bid/ask split plus exact volumes. Every frame redraws all of them from the current data. No diffing on the draw side.
Per-frame visibility culling is where the real work happens. For a footprint with 200 price levels visible, drawing every level at every detail level wastes GPU time. The renderer checks which levels fall within the current viewport, calculates approximate pixel height per level, and decides what to render. At high zoom, you draw bid/ask bars with exact volume numbers. When zoomed out and levels are 3 pixels tall, you draw a simple colored rectangle. The text rendering is skipped entirely when there isn’t enough vertical space.
This keeps frame time tight on desktop. A full footprint + heatmap + DOM + profile layout runs in around 4 to 6ms per frame on my machine, the entire budget including JS interop, against the ~8.3ms you get at 120FPS. Plenty of headroom.
I wanted this on any device, including my phone for the times I don’t have a laptop with me. Mobile is trickier to keep fast, but it holds up well, I use it every day.
The one cost that shows up most on mobile is the per-frame vertex upload. ImGui rebuilds its whole draw list every frame and its backend re-sends it to the GPU with glBufferData each time, so the heatmap rectangles get rebuilt and re-uploaded even when the liquidity hasn’t changed. That’s the immediate-mode backend’s default, not a limit of WebGL. Nothing stops you from leaving static geometry on the GPU and just drawing it again. On desktop the copy disappears into the frame budget. On mobile, where the CPU and GPU share one memory bus and a wide zoom pushes tens of thousands of vertices, it’s the main thing worth optimizing. That’s what the next experiment goes after.
Moving the heatmap to a GPU texture (experimental)
The orderbook heatmap is the worst offender for that vertex upload. It draws one filled rectangle per price level per candle, and at a wide zoom that’s thousands of rectangles, roughly two-thirds of every vertex in the frame. None of them are expensive to rasterize. The cost is rebuilding that geometry on the CPU and shipping it to WebGL every single frame. Pan the chart and the liquidity didn’t change, but all of it gets rebuilt and re-uploaded anyway.
So I stopped sending rectangles. The liquidity grid is just a 2D field, price on one axis, time on the other, a quantity at each cell. That’s a texture. I upload it once as a single-channel float texture, draw one quad over the plot, and a fragment shader maps each pixel back to a cell and colors it with the same viridis ramp the CPU path used. The heatmap goes from thousands of vertices to four. When the view is static, the per-frame upload is zero.
The part I like is that this didn’t mean leaving ImGui. ImGui lets you splice a raw draw callback into its command list with ImDrawList::AddCallback, so I drop down to raw WebGL2 for that one quad, my own shader, my own texture, then hand control straight back for the candles, the axes, and the text. No second renderer, no rewrite, no new framework. The per-cell volume labels still come from ImGui, painted on top of the texture.
The rendering is also decoupled from the UI framework, which means it travels. The shader is plain #version 300 es GLSL with zero dependency on ImGui or the app, it samples an R32F grid texture and a 256x1 LUT and maps each pixel back to a cell. That’s the actual “render a liquidity field on the GPU” logic, about 40 lines, and it drops into any WebGL2 context as-is. If I ever want this in another app I bring the shader over and wire up a texture and a few uniforms (the plot window, the threshold, the LUT). The AddCallback splice is the only ImGui-specific piece, and outside ImGui it gets simpler, just a normal draw call instead of injecting into the command list. The version line is the one knob, 300 es covers WebGL2 and mobile GLES3, 330 core for desktop OpenGL, same logic either way.
It’s experimental for now. It lives behind a toggle (settings -> GPU heatmap (beta)).
Embedding WASM into SvelteKit
The Emscripten build outputs two files: the .wasm binary and a .js glue module. SvelteKit treats these as static assets. The mounting sequence in the Svelte component looks roughly like:
import wasmInit from '/cryexc.js';

onMount(async () => {
  await wasmInit({
    canvas: document.getElementById('app-canvas'),
    // other emscripten module config
  });
});
The canvas element needs to exist in the DOM before onMount fires, which is why SvelteKit’s onMount is the right hook here. You’re not doing any SSR with this canvas. Emscripten sets canvas.style.width and canvas.style.height programmatically and takes over mouse and keyboard events through its own event listeners.
One pitfall worth knowing is WASM binary size. A release build of Cryexc is around 3.2MB gzipped. That’s acceptable for a desktop trading tool where users load it once and keep the tab open. Brotli compression in production helps, and Emscripten’s -O2 flag matters a lot compared to a debug build. Still worth noting that this may take some time to load on slower networks.
What you give up
Accessibility is the obvious one. ImGui renders to a canvas. There are no ARIA labels, no tab stops outside of what ImGui explicitly handles, no semantic structure that a screen reader can traverse. For a tool aimed at professional traders this is a pragmatic choice, but it’s not nothing. Don’t pretend otherwise.
Search engine indexability stops at the shell. Google can index the SvelteKit landing page, the other pages, everything in the HTML layer. It cannot see what ImGui renders. Any content inside the app canvas is invisible to crawlers. For a trading tool this doesn’t matter much, but if you were building something that needed its content indexed, this stack would be the wrong choice.
Font rendering behaves differently than HTML. Emscripten uses FreeType for font loading, and the results are visually close to native but not identical to browser text rendering. Emoji support requires explicit work. RTL languages require explicit work. For a trading terminal with monospace numerics this is a non-issue.
Finally, resource usage. A live cryexc tab sits around 300MB in Chrome’s readout, and the CPU can cost more than that, it’s parsing live data and redrawing complex visualizations on every frame. For the performance and the features I get back, it’s worth it to me.
Installing it as a PWA
cryexc installs as a PWA on chrome and any browser that supports it. It opens in its own window, no browser navbar eating the screen, which means more room for the footprint, heatmap, and orderbook. Works on desktop and mobile, and lives in your dock or home screen like a native app.
It was a quick win, and it saved me from maintaining a separate native build. I had been playing with a native macos app a few weeks earlier, the PWA gets the same standalone-window feel with none of that overhead.
Cryexc ships a web app manifest — name, icons, standalone display — so supporting browsers and OSes let you install it as a standalone app on desktop or home screen. Same URL, its own window.
The other pages
A few of the tools I was still opening outside cryexc had nothing to do with orderflow, so I built small SvelteKit pages to cover them. These live in the HTML shell, not the canvas, so they load instantly and they’re the one part of the app that’s actually indexable.
The watchlist was the last thing I was still opening tradingview for. Quick price checks on btc, gold, nq without spinning up the full imgui app. Once that existed, cryexc became the only crypto tool I use, desktop and mobile.
The symbol page replaced coingecko. A random crypto ticker shows up on X, paste it into the search, and you get price, chart, and performance on one page, across hyperliquid, binance, bybit, and others.
Single-symbol overview: price, market cap, 24h range, a hand-rolled SVG chart with time ranges, and a multi-timeframe performance grid.
/app/symbol ↗Multi-exchange watchlist, up to 8 symbols with sparklines and rolling % changes. Saved to localStorage, no account.
/app/watchlist ↗Market-cap flip calculator: what price coin A would reach at coin B's market cap, and back. Deep-links so you can share the comparison.
/app/flip ↗What I’d do differently
Earlier on I tried to push more concerns onto a backend than the architecture actually needed. Cross-exchange aggregation, alert delivery, even live tick fan-out — all of them ended up working better as separate concerns. Live data stays in the browser, full stop. Alerts run on a small dedicated service that consumes from exchanges directly. History is its own HTTP spec. Each piece does one thing and the live path stays free of any server I have to scale per-user.
The JavaScript glue layer that Emscripten generates is verbose and sometimes hard to debug when something goes wrong at the WASM boundary.
The full stack is live today. Every view in Cryexc runs on this exact architecture: C++ ImGui compiled to WASM, mounted into SvelteKit, exchange websockets straight from the browser, optional history backend if you want extended historical data. No accounts. The hosted version requires nothing of you. The history protocol lives at cryexc-history if you want to plug in your own backfill source.
If you want context on why I built this in the first place, that’s in the earlier post.
Questions on the architecture, feel free to reach out. @josedonato__ on X.